
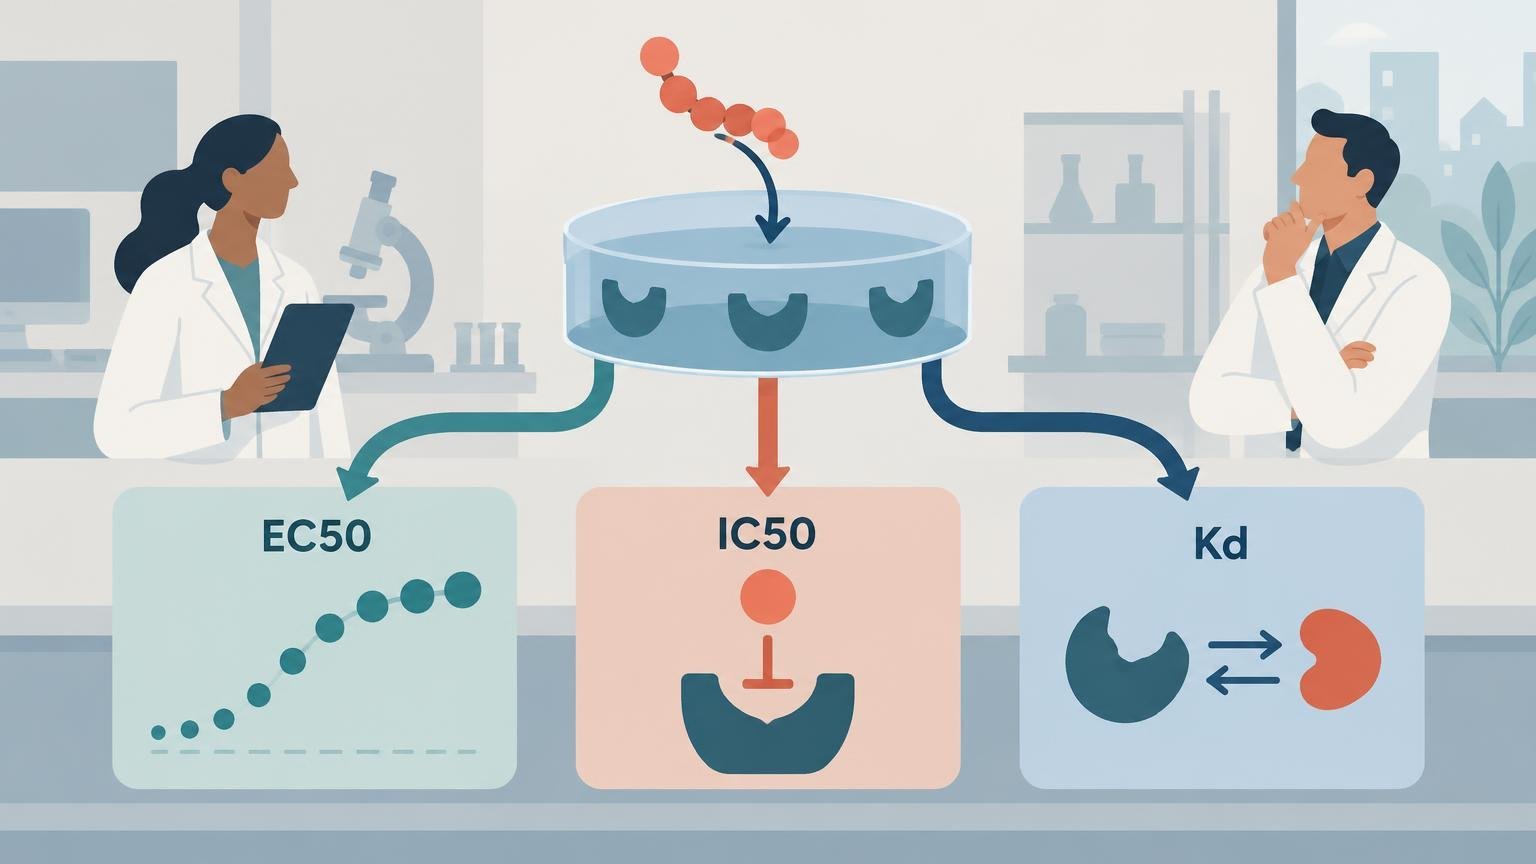
EC50, IC50, and Kd are often placed side by side as if they were interchangeable measures of how “strong” a peptide is. They are not. EC50 describes functional potency in a specified response assay. IC50 describes the concentration producing 50% inhibition of a defined signal or activity. Kd is an equilibrium binding constant. Each number answers a different experimental question, and each depends on how that question was measured.
The practical consequence is important: a peptide can bind tightly yet produce a modest functional response, or it can generate a half-maximal response at a concentration below its measured binding Kd because the biological system amplifies receptor activation. Comparing the numbers without examining the assay can therefore create a false impression of agreement—or contradiction—where none exists.
TLDR
- EC50 is the concentration that produces 50% of the fitted maximal effect in a particular functional assay. It measures apparent potency, not binding affinity.
- IC50 is the concentration that reduces a defined assay signal or activity by 50%. Its meaning depends on what is inhibited and on substrate, agonist, tracer, and assay conditions.
- Kd is an equilibrium dissociation constant for a binding interaction. Under the applicable binding model, a lower Kd conventionally indicates higher affinity.
- EC50, IC50, and Kd cannot be compared responsibly unless the target, assay system, endpoint, concentration basis, model, and experimental conditions are known.
- For peptides, adsorption, aggregation, degradation, modifications, and uncertainty about the freely available concentration can further separate the nominal concentration from the concentration reaching the target.
The three measurements at a glance
| Metric | Primary question | Typical experiment | What a lower value usually means | What it does not establish |
|---|---|---|---|---|
| EC50 | What concentration produces half of the fitted maximal response? | Functional concentration–response assay | Greater apparent functional potency in that assay | Higher binding affinity, greater maximal efficacy, or better in-vivo performance |
| IC50 | What concentration inhibits the defined signal by 50%? | Binding competition, enzyme, signaling, or cellular inhibition assay | Greater apparent inhibitory potency under those conditions | A particular inhibition mechanism or an assay-independent Ki |
| Kd | How is ligand distributed between bound and free states at equilibrium? | Saturation binding, kinetic binding, or a suitable competition method | Higher equilibrium binding affinity under the model used | Functional agonism, antagonism, efficacy, or a biological outcome |
These definitions are compact, but the qualifications are not optional. The phrase “in that assay” belongs beside every EC50 and IC50. A Kd likewise belongs to a specified target construct, physical environment, measurement method, and binding model.
EC50 measures functional potency
EC50 is obtained from a concentration–response relationship. Researchers expose a biological system to a range of peptide concentrations, measure an endpoint, fit a response curve, and identify the concentration corresponding to 50% of the fitted response range. The endpoint might be second-messenger production, calcium mobilization, reporter-gene activity, receptor internalization, enzyme activation, contraction of isolated tissue, or another functional readout.
That makes EC50 a property of the peptide–assay combination rather than an immutable molecular constant. The fitted baseline and maximum response affect its calculation. So do receptor abundance, receptor reserve, signal amplification, coupling efficiency, cell background, incubation time, and endpoint selection. The Assay Guidance Manual’s discussion of GPCR pharmacology explains why receptor expression and signaling context can materially alter apparent agonist potency and efficacy.
Receptor reserve is especially important. If a cell expresses more receptors than it needs to produce its maximal downstream signal, occupancy of only a fraction of those receptors may generate a half-maximal response. The measured EC50 can then be lower than the concentration associated with half receptor occupancy. This is one reason an EC50 below a binding Kd is not inherently an error.
EC50 also does not describe the maximum response. Two peptides can have similar EC50 values but different maximal effects, meaning one may be a full agonist in that system while the other behaves as a partial agonist. Conversely, receptor-rich systems can compress real pharmacological differences and make ligands appear similarly potent or efficacious. Peptide ligands may even display different apparent agonist or antagonist behavior as receptor density and coupling change.
Understanding this distinction is easier when binding and signaling are treated as separate stages. The related guide to how peptides interact with receptors and initiate cell signaling provides the broader mechanistic framework.
IC50 measures inhibition of a defined readout
IC50 is broader and, without context, more ambiguous. The International Union of Pure and Applied Chemistry defines inhibitory concentration in relation to a specified degree of inhibition; in routine pharmacology, IC50 usually denotes the concentration producing 50% inhibition. The IUPAC inhibitory-concentration definition is useful precisely because it centers the measured effect rather than implying a universal molecular property.
An IC50 may refer to inhibition of enzyme activity, displacement of a labeled ligand, suppression of an agonist-induced signal, reduced cell growth, or another phenotype. Those assays do not measure the same process. Even within one category, changing substrate concentration, agonist concentration, tracer concentration, incubation time, or target abundance can move the observed IC50. An isolated value therefore does not reveal whether inhibition is competitive, noncompetitive, allosteric, irreversible, or indirect.
In a competition-binding experiment, the absolute IC50 is the competitor concentration that reduces specific tracer binding to half its maximum. The curve must adequately span the midpoint for that estimate to be credible. A narrow concentration range that never reaches a lower plateau cannot support a well-constrained IC50 merely because curve-fitting software returns a number.
The inhibited quantity should always accompany the value. “IC50 = 20 nM” is incomplete. “IC50 = 20 nM for inhibition of an agonist-induced signaling response under the stated agonist and incubation conditions” is interpretable, although it still requires the complete methods and uncertainty estimate.
Kd measures equilibrium binding affinity
For a simple one-to-one equilibrium interaction between free ligand L, free receptor R, and complex LR, the dissociation constant is Kd = [L][R]/[LR]. Under that model, a lower Kd means that less free ligand is required to favor the bound state and therefore indicates higher equilibrium affinity.
Kd can be estimated from saturation-binding data, from kinetic measurements where Kd = koff/kon under an applicable model, or through appropriately designed competition experiments. These routes can agree when their assumptions fit the system, but agreement is not automatic. Equilibrium analysis requires evidence that equilibrium was reached; kinetic analysis requires a suitable association model; and competition analysis introduces assumptions about the tracer and interaction mechanism.
The equilibrium ligand-binding guidance by Hulme and Trevethick details several conditions that influence binding estimates, including temperature, buffer composition, target state, nonspecific-binding correction, and ligand depletion. A purified receptor fragment, membrane preparation, intact cell, and native tissue may present different receptor conformations and molecular environments.
A common simplification says that half the receptors are occupied when free ligand concentration equals Kd. The word “free” matters. If receptor concentration is appreciable relative to Kd, binding can deplete ligand from solution. The total ligand added at half occupancy may then exceed Kd, even though the free concentration follows the simple relationship. Using nominal total concentration without checking depletion can bias the interpretation.
Why EC50 and Kd often disagree
Binding is not the same as functional activation. A ligand must first associate with its target, but the bound complex must then stabilize receptor states and engage downstream machinery capable of generating the measured signal. Kd principally describes equilibrium occupancy; EC50 incorporates occupancy, intrinsic efficacy, coupling, amplification, and the endpoint’s dynamic range.
Several patterns are therefore plausible:
- EC50 below Kd: receptor reserve or downstream amplification allows a small occupied receptor fraction to produce a substantial response.
- EC50 near Kd: occupancy and response happen to align under the tested conditions, although numerical similarity does not prove a direct mechanistic identity.
- EC50 above Kd: the ligand binds well but has limited intrinsic efficacy, coupling is inefficient, or substantial occupancy is required to reach half of the system’s maximum response.
- A measurable Kd but no agonist EC50: the peptide binds without activating the selected pathway, or the assay cannot detect the relevant response.
- Different EC50 values with a similar Kd: the systems differ in receptor density, coupling, endpoint, amplification, or peptide availability.
This distinction also explains why functional potency in cultured cells should not be treated as a prediction of organism-level effectiveness. Exposure, distribution, degradation, tissue context, and compensatory biology introduce additional questions. The comparison between in-vitro and in-vivo peptide research helps separate those evidence levels.
Why IC50 cannot automatically be converted into Ki
Ki is an inhibition constant associated with a specified mechanistic model. IC50 is an empirical midpoint under the chosen assay conditions. They can sometimes be related mathematically, but only when the model’s assumptions are appropriate.
For simple competitive enzyme inhibition, the Cheng–Prusoff relationship is commonly written as Ki = IC50/(1 + [S]/Km), where [S] is substrate concentration and Km is the Michaelis constant under the applicable model. Competition radioligand binding uses a different form involving tracer concentration and the tracer’s Kd. These equations are not interchangeable.
The simplest conversion may fail with cooperativity, complex binding mechanisms, noncompetitive behavior, ligand depletion, multiple binding sites, or slopes inconsistent with the assumed model. The original Cheng–Prusoff analysis and later work on cooperativity make the larger point clear: conversion is a model-based inference, not a relabeling of the IC50.
Peptide-specific factors can change apparent potency
Peptides introduce practical concentration uncertainties that are easy to overlook. The nominal concentration prepared by the researcher is not always the freely available concentration at the biological target. Depending on the sequence and assay, a peptide may adsorb to tubes, plates, glass, membranes, or other surfaces; associate nonspecifically with proteins or lipids; aggregate; undergo enzymatic degradation; or change oxidation state during the experiment.
Published studies have reported substantial surface association for certain cationic cell-permeable peptides and interactions between amphiphilic peptides and model surfaces. These findings do not mean every peptide adsorbs substantially, but they show why surface effects should be evaluated rather than assumed absent.
Sequence modifications also matter. Amidation, acetylation, cyclization, lipidation, substitutions, labels, linkers, and terminal extensions can alter charge, conformation, stability, nonspecific association, or target interaction. A potency value for one molecular form should not silently be assigned to another.
Assay timing can further change the result. A short endpoint may emphasize rapid association and signaling, whereas a long incubation may incorporate desensitization, internalization, degradation, or slow equilibration. An equilibrium Kd and a time-dependent functional response answer related but distinct questions.
How to compare peptide pharmacology results responsibly
Before concluding that one peptide is more potent or binds more tightly than another, check whether the measurements are genuinely comparable. The biomolecular-assay guidelines from Jarmoskaite and colleagues emphasize assay design, controls, model selection, and uncertainty rather than treating fitted values as self-validating outputs.
- Confirm molecular identity. Record the peptide sequence, modifications, labeling, counterion where relevant, and molecular form used in the assay.
- Identify the target and system. Note the target construct, receptor species, expression level, cell type, membrane preparation, or purified system.
- Define the readout. State what EC50 or IC50 refers to rather than reporting the acronym alone.
- Review concentration conditions. Check the tested range, dilution design, replicates, and whether free concentration plausibly differs from nominal total concentration.
- Inspect the complete curve. Look for defined upper and lower plateaus, adequate coverage of the midpoint, systematic residuals, and unusual Hill slopes.
- Examine the fitted model. A four-parameter logistic fit, binding isotherm, competition model, or mechanistic kinetic model carries different assumptions.
- Report uncertainty. Confidence intervals and replicate-level variability are more informative than excessive decimal precision in the fitted midpoint.
- Check assay-specific controls. These may include nonspecific binding, vehicle, reference ligand, inactive controls, degradation checks, and signal-window assessment.
- Compare like with like. Cross-laboratory values are strongest when target format, endpoint, temperature, buffer, timing, and analysis are closely aligned.
- Keep conclusions at the measured level. Binding supports a binding conclusion; a signaling assay supports a pathway-specific functional conclusion. Neither alone establishes an in-vivo outcome.
Understanding pEC50, pIC50, and pKd
Pharmacology results are often presented on a negative logarithmic scale. pIC50 is −log10(IC50), and pKd is −log10(Kd), with the underlying concentration expressed in molar units. The same convention is commonly applied to EC50 as pEC50.
On this scale, larger values represent lower underlying concentrations. For example, 10 nM is 10⁻⁸ M and corresponds to a p-value of 8. A one-unit difference represents a tenfold concentration difference. Researchers should state the unit convention because taking a logarithm of a value entered in nanomolar units rather than converting it to molar units produces a misleading result.
Frequently asked questions
Is a lower EC50 always better?
No. A lower EC50 indicates greater apparent potency for the measured response under the stated conditions. It does not establish a larger maximum response, better selectivity, stronger binding, greater stability, or a superior outcome in another biological system.
Does a low Kd mean a peptide is a strong agonist?
Not necessarily. A low Kd supports high equilibrium binding affinity under the tested binding model. Agonism requires functional evidence. A tightly binding ligand could be a full agonist, partial agonist, antagonist, inverse agonist, or functionally silent in the selected assay.
Can IC50 values from two papers be compared directly?
Only after checking what was inhibited and whether the important assay conditions match. Differences in substrate, agonist, tracer, target abundance, incubation time, endpoint, and curve model can shift IC50 independently of the peptide’s underlying interaction.
Why can the same peptide have several EC50 values?
Different endpoints and biological systems can convert receptor occupancy into response differently. Receptor density, coupling proteins, amplification, desensitization, cell background, and incubation time can all change the apparent midpoint. Multiple values can therefore be valid descriptions of different assays.
Which metric should be used to rank peptide candidates?
That depends on the research question. Use Kd when equilibrium affinity is the primary question, EC50 when functional potency is central, and IC50 when inhibition of a specified process is being measured. Candidate selection often requires several complementary measurements rather than a single ranking number.
The strongest interpretation starts with the assay
EC50, IC50, and Kd are useful because they compress concentration-dependent data into interpretable parameters. That compression becomes misleading when the parameter is separated from the experiment that generated it.
The most defensible reading is narrow and explicit: EC50 describes functional potency for a particular response, IC50 describes inhibition of a defined signal under specified conditions, and Kd describes equilibrium binding affinity under an applicable model. Comparing peptides requires the curves, methods, controls, uncertainty, and biological context—not just the smallest number.
References
- Glossary – PubChem
- Glossary | IUPHAR – PEP
- Pharmacological Characterization of GPCR Agonists, Antagonists, Allosteric Modulators and Biased Ligands from HTS Hits to Lead Optimization – Assay Guidance Manual – NCBI Bookshelf
- GraphPad Prism 11 Curve Fitting Guide – The EC50
- Ligand binding assays at equilibrium: validation and interpretation – PMC
- The peptidic urotensin-II receptor ligand GSK248451 possesses less intrinsic activity than the low-efficacy partial agonists SB-710411 and urantide in native mammalian tissues and recombinant cell systems – PMC
- IUPAC – inhibitory concentration (I03036)
- Quantifying the Interactions between Biomolecules: Guidelines for Assay Design and Data Analysis – PMC
- Data Standardization for Results Management – Assay Guidance Manual – NCBI Bookshelf
- Comparative Analysis of Biochemical and Cellular Assay Conditions and the Need for a Buffer That Mimics Cytoplasmic Environments – PMC
- Perspective: Implications of Ligand–Receptor Binding Kinetics for Therapeutic Targeting of G Protein-Coupled Receptors
- Relationship between the inhibition constant (K1) and the concentration of inhibitor which causes 50 per cent inhibition (I50) of an enzymatic reaction – PubMed
- The influence of cooperativity on the determination of dissociation constants: examination of the Cheng-Prusoff equation, the Scatchard analysis, the Schild analysis and related power equations.
- Binding of cationic cell-permeable peptides to plastic and glass – PubMed
- A method for probing the affinity of peptides for amphiphilic surfaces – PubMed