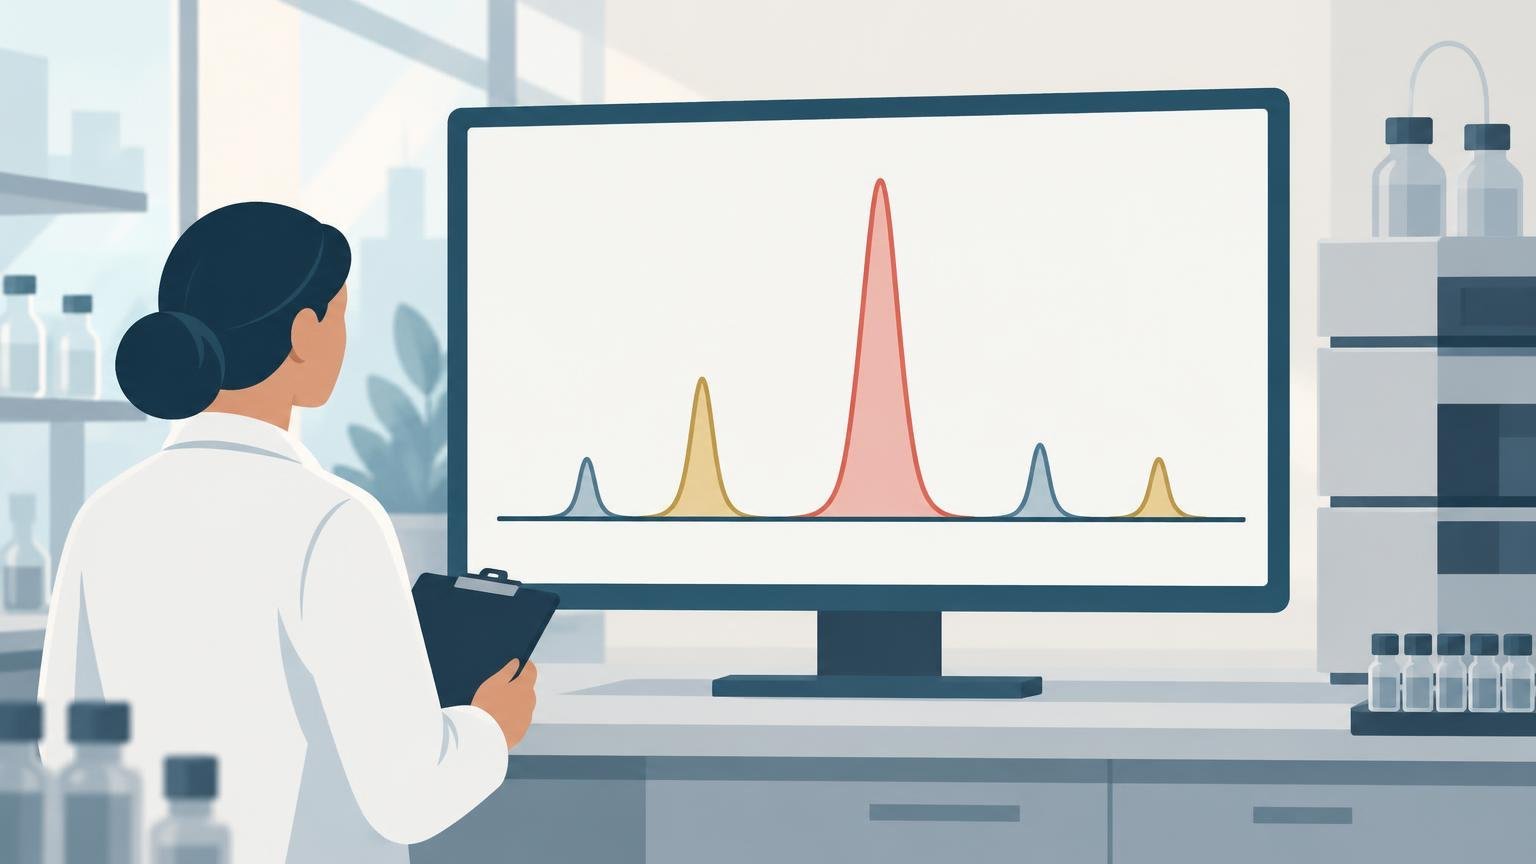
TLDR: A peptide HPLC peak area percentage is the integrated detector response for one peak divided by the total relevant integrated response, usually multiplied by 100. It describes how the sample appeared under a particular method, detector wavelength, and set of integration rules. It does not automatically equal the percentage of peptide by mass, confirm molecular identity, or measure biological potency. Detector-response differences, coelution, wavelength selection, and integration settings can all change the reported value.
An HPLC report showing a main peak of 99.2% can look like a direct statement about the composition of a peptide sample. The result is useful, but its meaning is narrower: under the stated chromatographic conditions, the main peak accounted for 99.2% of the response included in the calculation. Interpreting that number correctly requires knowing what was detected, which peaks entered the denominator, and whether the method adequately separated the target from potential impurities.
What peak area percent means
In a basic area-normalization calculation, the chromatography data system integrates the area under each relevant peak. For peak i, the calculation is:
Peak area percent = area of peak i ÷ sum of all relevant integrated peak areas × 100
If a method applies correction factors, the corrected response replaces the uncorrected area in both the numerator and denominator. The USP Pharmacopeial Forum discussion of area normalization describes the result in terms of individual peak response relative to the total relevant peak response, with specified correction factors applied where appropriate. Importantly, the denominator need not include every signal visible in the chromatogram. A procedure may specify reporting thresholds, exclusions, blank-related peaks, or other rules defining which responses are relevant.
This makes peak area percent a method-defined relative measurement. It is not an absolute measurement of how many milligrams of target peptide are present. If the main peak contributes 99% of the included detector response, the remaining included peaks contribute 1%. That relationship is internally useful, but it does not establish that 99% of the vial’s total mass is the target peptide.
Why area percent is not the same as peptide content
Area normalization assumes that detector response is a suitable proxy for the relative amounts being compared. The simplest calculation effectively treats equal response as equal amount. That assumption may be reasonable for structurally similar substances under a validated method, but it is not universally true. Different analytes can produce different signal intensities at the same concentration, so a method may need relative response factors or another correction strategy.
Peptide content asks a different question: how much of the total material is peptide, usually on a stated mass basis. A dried peptide preparation can also contain water, counterions, residual solvents, salts, or other non-UV-active material. Components that do not produce an included chromatographic peak do not contribute to the area-normalization denominator. Consequently, a high main-peak area percentage can coexist with a lower peptide content result.
The distinction is developed further in peptide content versus purity. The central point is that chromatographic purity, peptide content, molecular identity, and biological activity are separate measurands. One result should not be silently substituted for another.
| Result | What it primarily addresses | What it does not establish by itself |
|---|---|---|
| HPLC peak area percent | Relative detector response under the stated chromatographic procedure | Absolute peptide mass, identity, sterility, or potency |
| Mass spectrometry | Whether an observed mass is consistent with the expected analyte | Chromatographic purity, peptide content, or biological activity |
| Peptide-content assay | Amount of peptide under the assay’s defined basis and calibration | Identity of every component or biological potency |
| Biological assay | Activity in a specified experimental system | Clinical effectiveness or complete chemical characterization |
Detection wavelength changes the response
UV detection is common in reversed-phase peptide HPLC, but “UV area” is not a wavelength-independent property. Peptide bonds absorb strongly in the low-UV region, so wavelengths around 210–220 nm are commonly used to monitor peptide separations. At 280 nm, response depends much more strongly on aromatic residues, particularly tyrosine and tryptophan.
This matters because the target peptide and its impurities may not share the same chromophores. A truncated sequence that removes an aromatic residue, for example, may respond differently relative to the intact peptide at 280 nm than it does at a lower wavelength. Non-peptide components can also have wavelength-dependent responses. Changing the wavelength may therefore change the relative areas even when the injected sample has not changed.
A reported percentage should be read together with the detector type and wavelength. Comparisons between laboratories—or between two methods in the same laboratory—are much less informative when those conditions differ. A 99% result at one wavelength is not automatically interchangeable with a 99% result obtained using another method.
Coelution can inflate the apparent main peak
Area normalization can only distinguish components that the chromatographic method resolves and the detector recognizes. If an impurity coelutes with the target peptide, both compounds can contribute to what the data system integrates as one main peak. The apparent main-peak percentage may then exceed the target peptide’s true share of the included response.
This is why chromatographic selectivity matters. The ICH Q2(R2) analytical validation guideline defines specificity or selectivity around measuring an analyte without interference from impurities, degradation products, matrix components, or other potential interferences. It also recommends combining analytical procedures when one procedure does not provide adequate discrimination.
For peptide characterization, UV-HPLC and mass spectrometry answer complementary questions. HPLC can show how the sample’s detectable components separate under the method, while mass analysis can test whether an observed molecular mass is consistent with the expected peptide. Associating mass information with chromatographic peaks can also help investigate suspected impurities. A practical comparison is available in HPLC versus LC-MS for peptide analysis.
Even this combination has boundaries. A mass consistent with the expected peptide supports identity, but it does not prove that every molecule under a broad or unresolved UV peak is the same compound. Conversely, a clean chromatogram does not identify the main peak without orthogonal evidence.
Integration settings are part of the result
Peak areas are generated by data processing rather than read directly from the chromatogram. The software must decide where a peak begins and ends, how the baseline is drawn, whether a shoulder is treated as a separate peak, and which small signals pass the reporting threshold.
Common processing parameters include peak width, slope sensitivity, area or height rejection, baseline correction, shoulder detection, and rules for incompletely separated peaks. Changing these settings can split one response into two peaks, combine adjacent responses, or alter the calculated area assigned to the main peak.
That does not make integration arbitrary. A defensible procedure defines scientifically justified processing rules and applies them consistently. Manual reintegration may be appropriate when the automated result clearly mishandles a peak, but it should be documented and governed rather than used simply to obtain a preferred percentage.
Blank runs are also important. Solvent, gradient, system, or carryover signals may appear in a chromatogram without originating from the peptide sample. A blank can help identify such signals, although excluding a peak from normalization still requires a reason tied to the method and the analytical objective.
How to evaluate a reported peptide HPLC percentage
A peak area percentage becomes more interpretable when it is accompanied by enough method context to explain how the number was produced. Useful questions include:
- Was the percentage calculated by uncorrected area normalization, corrected area normalization, or calibration against a reference standard?
- Which detector and wavelength were used?
- Which peaks were included in or excluded from the denominator?
- Were reporting thresholds or response factors applied?
- Was the target peak identified using a reference standard, mass spectrometry, or another orthogonal method?
- Did the method demonstrate adequate resolution from known impurities and degradation products?
- Were the integration parameters defined and consistently applied?
- Were blank, system-suitability, and replicate data acceptable for the intended use?
The amount of evidence needed depends on the intended conclusion. A preliminary research check may not require the same validation package as a formal quantitative procedure. For quantitative use, however, the analytical procedure should be fit for purpose. ICH Q2(R2) identifies characteristics including specificity or selectivity, accuracy, and precision as relevant to method performance, while pharmacopeial chromatography guidance cautions that peak interference can reduce the accuracy of area measurements.
The scientifically defensible interpretation
The strongest concise interpretation is: “The main peak represented X% of the relevant integrated detector response under the stated HPLC method.” That wording preserves what the experiment measured without converting the result into an unsupported claim about total mass, identity, or potency.
Peak area percent remains valuable for comparing chromatographic profiles, monitoring degradation, evaluating purification, and estimating relative impurity responses when the procedure is appropriate. Its reliability comes from the full method: separation, detector response, wavelength, integration, system performance, and evidence of selectivity. The percentage alone is the endpoint of that method, not a complete description of the sample.
Frequently asked questions
Does 99% HPLC peak area mean a peptide is 99% pure?
It may support a statement of 99% chromatographic purity under the specified method, but only in that defined analytical sense. It does not automatically mean that 99% of the total material by mass is target peptide, nor does it establish molecular identity, sterility, or biological potency.
Can two laboratories obtain different peak area percentages from the same peptide?
Yes. Differences in column chemistry, mobile phase, gradient, temperature, wavelength, detector response, injection conditions, resolution, and integration rules can change the chromatographic profile and calculated percentage. A meaningful comparison requires substantially comparable methods and samples.
Why might the percentage change at 214 nm versus 280 nm?
The target peptide and its impurities may absorb differently at those wavelengths. Low-UV detection reflects peptide-bond absorption more broadly, whereas 280 nm response depends much more on aromatic residues such as tyrosine and tryptophan. Relative peak areas can therefore change with wavelength.
Can mass spectrometry replace HPLC peak-area analysis?
Not generally. The methods answer different questions. Mass spectrometry provides molecular-mass information, while chromatographic peak areas describe detector responses after separation. Using orthogonal methods is often more informative than treating either result as a complete characterization.
References
- Pharmacopeial Forum
- Opioid Peptides: Molecular Pharmacology, Biosynthesis, and Analysis, 70
- ICH Q2(R2) Guideline
- Appendix: HPLC Nomenclature | Waters
- Recommendations for the generation, quantification, storage and handling of peptides used for mass spectrometry-based assays – PMC
- Data Analysis Reference Guide
- Restricting Access to Data Manipulation Tools (Part 4) | Waters Blog
- <621> CHROMATOGRAPHY