TLDR
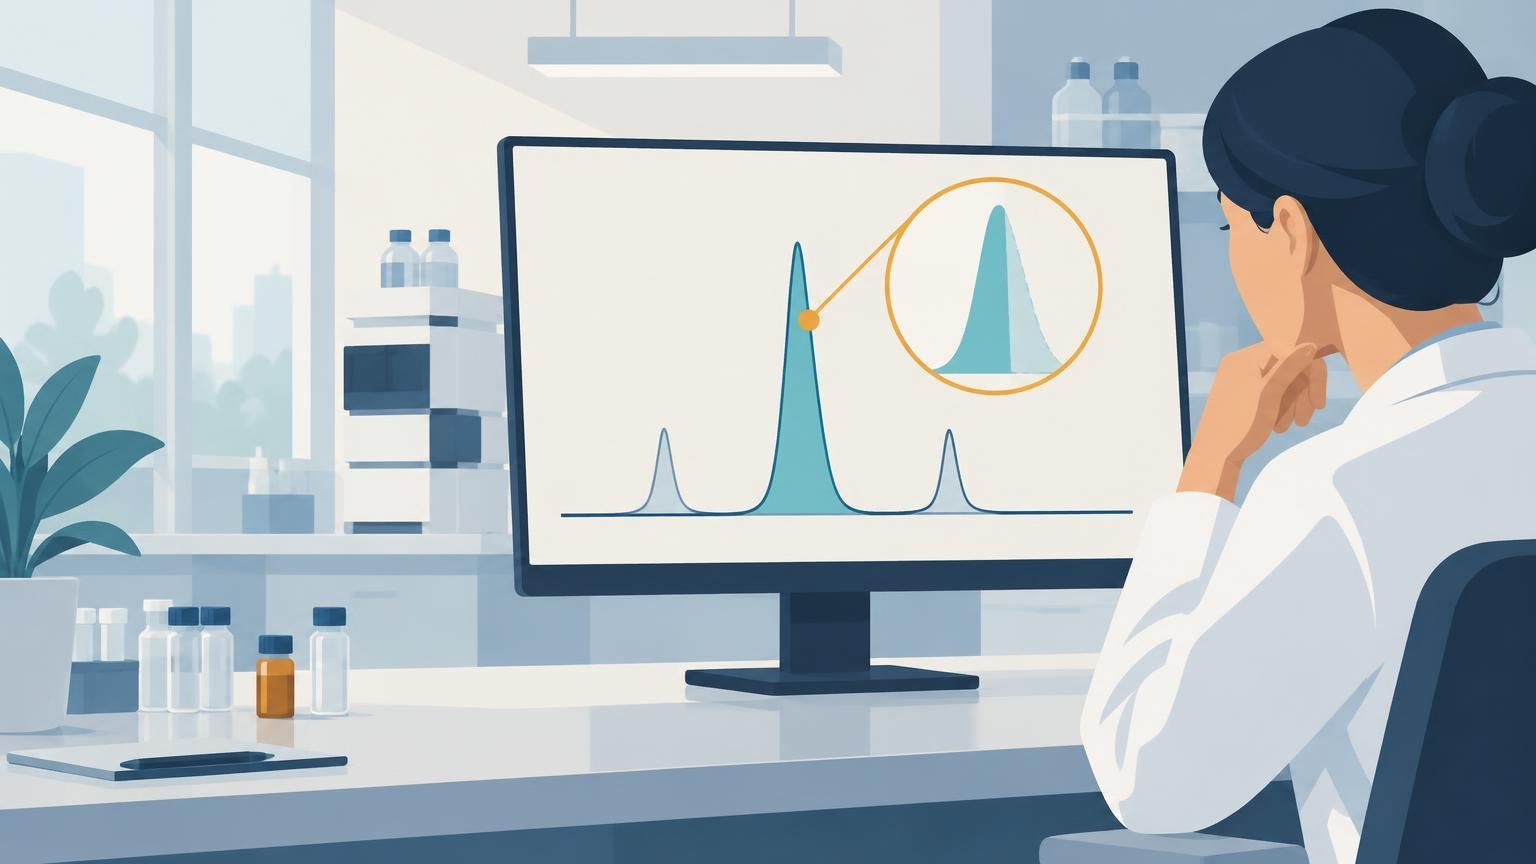
An HPLC chromatogram peptide report plots detector response against retention time. Start by identifying the chromatogram type and detector, then examine the axes, main peak, integration boundaries, baseline, minor peaks, and method conditions. A large integrated peak can support a high area percentage under that specific method, but the trace alone does not establish molecular identity, absolute peptide content, sterility, biological activity, or suitability for a particular use.
The most important principle when reading an HPLC chromatogram peptide trace is to separate observation from conclusion. You may observe one dominant peak and several smaller signals. Whether those signals represent the target peptide, related substances, sample-preparation artifacts, solvent effects, or co-eluting compounds requires more information than the picture alone provides.
What a peptide HPLC chromatogram shows
Chromatography separates sample components as they move through a stationary phase carried by a mobile phase. The detector records compounds as they leave the column, producing peaks over time. The official USP chapter on chromatography principles and terminology describes chromatographic responses in terms that include peak area and peak height. It also recognizes that one apparent peak can contain more than one unresolved component.
For an intact-peptide reversed-phase HPLC analysis, the trace often helps answer a method-specific question: how much of the detected, integrated signal is associated with the main chromatographic peak versus other included peaks? This is useful, but narrower than asking how much peptide is present by mass or whether the main peak has the expected molecular structure.
A useful way to keep the concepts separate is that HPLC primarily describes chromatographic behavior, while mass spectrometry provides evidence about molecular mass. Neither result automatically establishes peptide content, biological potency, sterility, endotoxin status, or every possible contaminant. For a fuller comparison, see what HPLC and LC-MS each measure in peptide analysis.
First identify what kind of chromatogram you have
Not every graph labeled “HPLC” or “LC-MS” represents the same experiment. Before interpreting the peaks, read the report title, detector label, method description, and sample-preparation notes.
| Chromatogram type | What was analyzed | Typical interpretation |
|---|---|---|
| Intact-peptide RP-HPLC trace | The peptide sample without enzymatic digestion | Compares the main detected peak with other chromatographic signals under the stated method |
| Peptide map | Fragments generated through controlled digestion or another cleavage procedure | Compares a pattern of fragment peaks with an expected or reference profile |
| UV LC-MS chromatogram | Eluting compounds measured by UV detection in an LC-MS workflow | Shows UV-active signals but does not itself display mass information |
| Total ion chromatogram, or TIC | The summed mass-spectrometric ion signal recorded at each time | Shows total detected ion intensity across the selected acquisition range |
| Base peak chromatogram, or BPC | The most intense ion at each time point | Emphasizes the strongest ion and can differ visually from a TIC |
| Extracted ion chromatogram, or XIC | Signal extracted for a selected mass-to-charge range | Tracks ions matching a defined m/z window rather than all detected compounds |
A peptide map is not simply a more complicated intact-peptide purity trace. Peptide-mapping workflows may use enzymatic digestion followed by chromatographic separation and UV or mass-spectrometric detection. Digestion, handling, and analytical conditions can affect the resulting profile or introduce artifacts. Appropriately validated peptide mapping is also recognized in ICH Q6B as an established structural characterization approach for biotechnology and biological products.
How to read the axes
The x-axis: retention time
The horizontal axis usually represents retention time, commonly in minutes. Retention time is the interval between injection and detection of a component as it exits the column. A peak at 12 minutes therefore indicates when that signal appeared under the stated chromatographic conditions; it does not mean the compound has a particular concentration, purity, or molecular mass.
Retention time can support comparison when the test and reference are analyzed under suitably controlled conditions. It is not a universal identity fingerprint. Changes in column chemistry, column age, gradient, mobile-phase composition, flow rate, temperature, instrument dwell volume, sample matrix, or system performance can shift retention. Even under the same nominal method, an identity conclusion generally requires more than matching a number printed beside a peak.
The y-axis: detector response
The vertical axis shows detector response, but the meaning and units depend on the detector. A UV chromatogram may report absorbance units or milli-absorbance units, often abbreviated mAU. A fluorescence detector reports fluorescence response. A mass-spectrometric TIC, BPC, or XIC reports ion signal rather than UV absorbance.
Peak height is therefore a signal measurement, not a direct visual scale of milligrams of peptide. Different compounds can produce different responses at the same molar or mass concentration. In UV detection, response depends partly on wavelength and the analyte’s light-absorbing chemical groups. Detector saturation, excessive sample loading, and acquisition settings can further complicate interpretation.
Retention time: comparison evidence, not identity by itself
A main peak appearing near an expected retention time is consistent with the expected chromatographic behavior. That observation becomes more informative when a reference standard is run under the same method, system suitability is acceptable, and the retention-time acceptance criteria were established beforehand.
It still does not prove that the peak contains only the expected peptide. Two components with insufficient chromatographic resolution can co-elute and appear as one peak. USP chromatography guidance explicitly cautions that a chromatographic peak can represent one component or multiple unresolved components. This is why apparently clean chromatography and correct molecular identity are related but separate analytical questions.
Peak area and integration
Peak area is the detector response integrated across a selected time interval. Software estimates the region between the signal and an assigned baseline, bounded by the chosen start and end points. In a normalized area calculation, each included peak area is divided by the sum of all included peak areas and expressed as a percentage.
That calculation can look objective while still depending on analytical choices. Integration rules determine where a peak begins and ends, how shoulders are treated, whether closely spaced peaks are split, how the baseline is drawn, and which signals are excluded. Solvent fronts, blank-related peaks, or signals below a reporting threshold may be omitted according to the method. Manual reintegration can also change the result and should be controlled and documented rather than used selectively.
A reported value such as 99% area therefore means that the main peak accounted for approximately 99% of the included detector response under the stated method and integration procedure. It does not automatically mean that 99% of the vial’s total mass is the target peptide. Water, salts, counterions, and substances that respond weakly or not at all under the selected detection conditions may not be represented proportionally.
This distinction is central to interpreting how peptide purity percentages are measured. Chromatographic purity, molecular identity, and peptide content answer different questions even when they appear together on the same certificate of analysis.
How to interpret the baseline and peak shape
The baseline represents the detector signal when no discrete analyte peak is being assigned. A perfectly flat line is not required, but baseline behavior affects the confidence with which small peaks can be detected and integrated.
- Random high-frequency noise can make very small peaks difficult to distinguish from normal signal variation.
- Gradual drift may accompany a changing mobile-phase composition, temperature effects, column bleed, detector equilibration, or other method-related behavior.
- A broad baseline disturbance near injection may reflect the solvent front or mismatch between the sample solvent and initial mobile phase.
- Peak tailing can complicate where integration should end and may obscure a nearby minor component.
- Peak fronting or flattening may indicate overloading or another chromatographic problem, although the trace alone is not sufficient to diagnose the cause.
- A shoulder on the main peak can suggest partial separation of another component, but confirmation requires better resolution or complementary evidence.
These features should be evaluated against method expectations, blanks, standards, replicate injections, and system-suitability results. A visually unusual peak is a prompt to investigate, not a diagnosis. HPLC system suitability in peptide analysis explains how measures such as repeatability, resolution, and peak shape help determine whether the system was performing adequately for the analysis.
What minor peaks can—and cannot—mean
Small peaks may represent peptide-related variants, truncated sequences, deletion products, oxidation products, deamidated species, aggregates that remain soluble under the method, residual synthesis-related compounds, sample-preparation artifacts, mobile-phase contaminants, carryover, or instrument-related signals. Their presence alone does not identify them.
It is equally unsafe to assume every small peak is an impurity or that every unassigned peak is harmless. A blank run can help reveal system or solvent signals. Spiking, altered chromatographic conditions, fraction collection, intact-mass analysis, or LC-MS/MS may provide more specific evidence. The appropriate investigation depends on the analytical purpose and the consequences of misidentification.
The main peak also deserves the same caution. It is often reasonable to call it the “main chromatographic peak,” but calling it “the peptide” requires identity evidence. Co-elution means that multiple compounds can contribute to one apparent peak, while a single peptide can sometimes produce more than one signal because of conformational behavior, chemical modification, or method-dependent separation.
Why the method context controls interpretation
An analytical procedure should be suitable for its intended purpose. Relevant validation characteristics can include specificity, accuracy, precision, and working range, depending on what the procedure is designed to measure. A method intended for a qualitative profile comparison is not automatically suitable for quantitative impurity measurement, and a method that resolves one peptide’s related substances may perform differently for another sequence.
At minimum, interpretation should consider the column and stationary phase, column dimensions, mobile phases, gradient program, flow rate, temperature, detector and wavelength, injection amount, run time, sample solvent, sample preparation, integration settings, and reporting threshold. Without that context, chromatograms from different laboratories cannot be compared reliably merely because both reports say “RP-HPLC.”
Method context also explains why retention time and area percentage can change even when the underlying sample has not materially changed. Conversely, a similar-looking trace does not prove two samples are equivalent if the methods, response factors, or integration rules differ.
Why HPLC is often paired with mass spectrometry
HPLC and mass spectrometry provide complementary evidence. Chromatography asks how detected components separate and how their responses compare under a method. Mass spectrometry asks whether observed ions and derived molecular masses are consistent with the expected analyte. LC-MS/MS can add sequence-related fragment evidence when the experiment and data quality support that interpretation.
An FDA peptide-mapping example illustrates this complementary approach by using peak integration and relative retention-time or peak-area comparisons alongside LC-MS/MS analysis. The important distinction is that one technique does not silently answer the other technique’s question. A dominant HPLC peak does not prove molecular identity, and an expected mass does not establish chromatographic purity or exclude isobaric and co-eluting species.
A practical chromatogram and COA checklist
Before accepting the reported percentage at face value, verify whether the accompanying documentation lets you connect the trace to a defined sample, method, and result.
- Sample or product identity and, where applicable, a traceable lot number
- Analysis date and report identifier
- Whether the trace is intact-peptide HPLC, a peptide map, or an LC-MS chromatogram
- Detector type and, for UV detection, the recorded wavelength
- Column identity and major method conditions
- Clearly labeled retention-time and response axes
- Peak table showing retention times, areas, and area percentages where relevant
- Integration approach, reporting threshold, and excluded peaks or regions
- System-suitability information appropriate to the method
- Reference-standard or comparison information when retention matching is part of the conclusion
- Complementary mass-spectrometric evidence when molecular identity is claimed
- An explanation of what the reported purity term means
A chromatogram image without sample identity, method context, or a peak table is much less informative than a trace connected to a specific analysis. Lot linkage and analytical context do not guarantee that every conclusion is correct, but they make the report reviewable and allow the reader to understand what was actually measured.
Frequently asked questions
Does the largest peak always represent the target peptide?
No. It represents the largest integrated detector response under the method. An expected retention time and complementary mass evidence can support assignment, but peak size alone does not establish identity.
Is HPLC area percentage the same as purity by mass?
Not automatically. Area percentage is a normalized detector-response measurement for included peaks. Absolute mass purity requires appropriate quantitative methods, standards, response assumptions, and accounting for material that the chromatogram may not represent proportionally.
Why did the retention time change between reports?
Potential reasons include changes in column chemistry or condition, gradient timing, mobile-phase composition, temperature, flow, instrument volume, sample matrix, and system performance. Retention times are most meaningfully compared under the same controlled method.
Can one apparent HPLC peak contain two compounds?
Yes. If the method does not resolve the compounds sufficiently, they may co-elute and contribute to one apparent peak. Orthogonal analysis or improved separation may be needed to detect the overlap.
Does a clean HPLC trace establish that a sample is sterile?
No. Chromatographic purity and sterility are different quality attributes measured by different procedures. An HPLC trace also does not establish endotoxin status, biological potency, clinical effectiveness, or suitability for administration.
Conclusion
Read a peptide HPLC chromatogram in layers: identify the experiment, understand the axes, locate the main and minor peaks, examine the baseline and peak shape, review the integration rules, and then check the method context. The strongest defensible conclusion is usually method-specific: the trace shows how detected and integrated signals were distributed under the stated chromatographic conditions.
The next step is to match the analytical evidence to the actual question. Use HPLC for chromatographic profile and method-specific area comparisons, mass spectrometry for molecular-mass evidence, quantitative assays for peptide content, and dedicated tests for other quality attributes. That disciplined separation prevents an attractive chromatogram from being asked to prove more than it measured.
References
- 〈621〉 Chromatography
- Stage 4 Harmonization
- Development of an LC-MS/MS peptide mapping protocol for the NISTmAb | Analytical and Bioanalytical Chemistry | Springer Nature Link
- Development of an LC-MS/MS peptide mapping protocol for the NISTmAb | NIST
- GUIDELINE FOR GOOD CLINICAL PRACTICE
- database.ich.org
- www.fda.gov